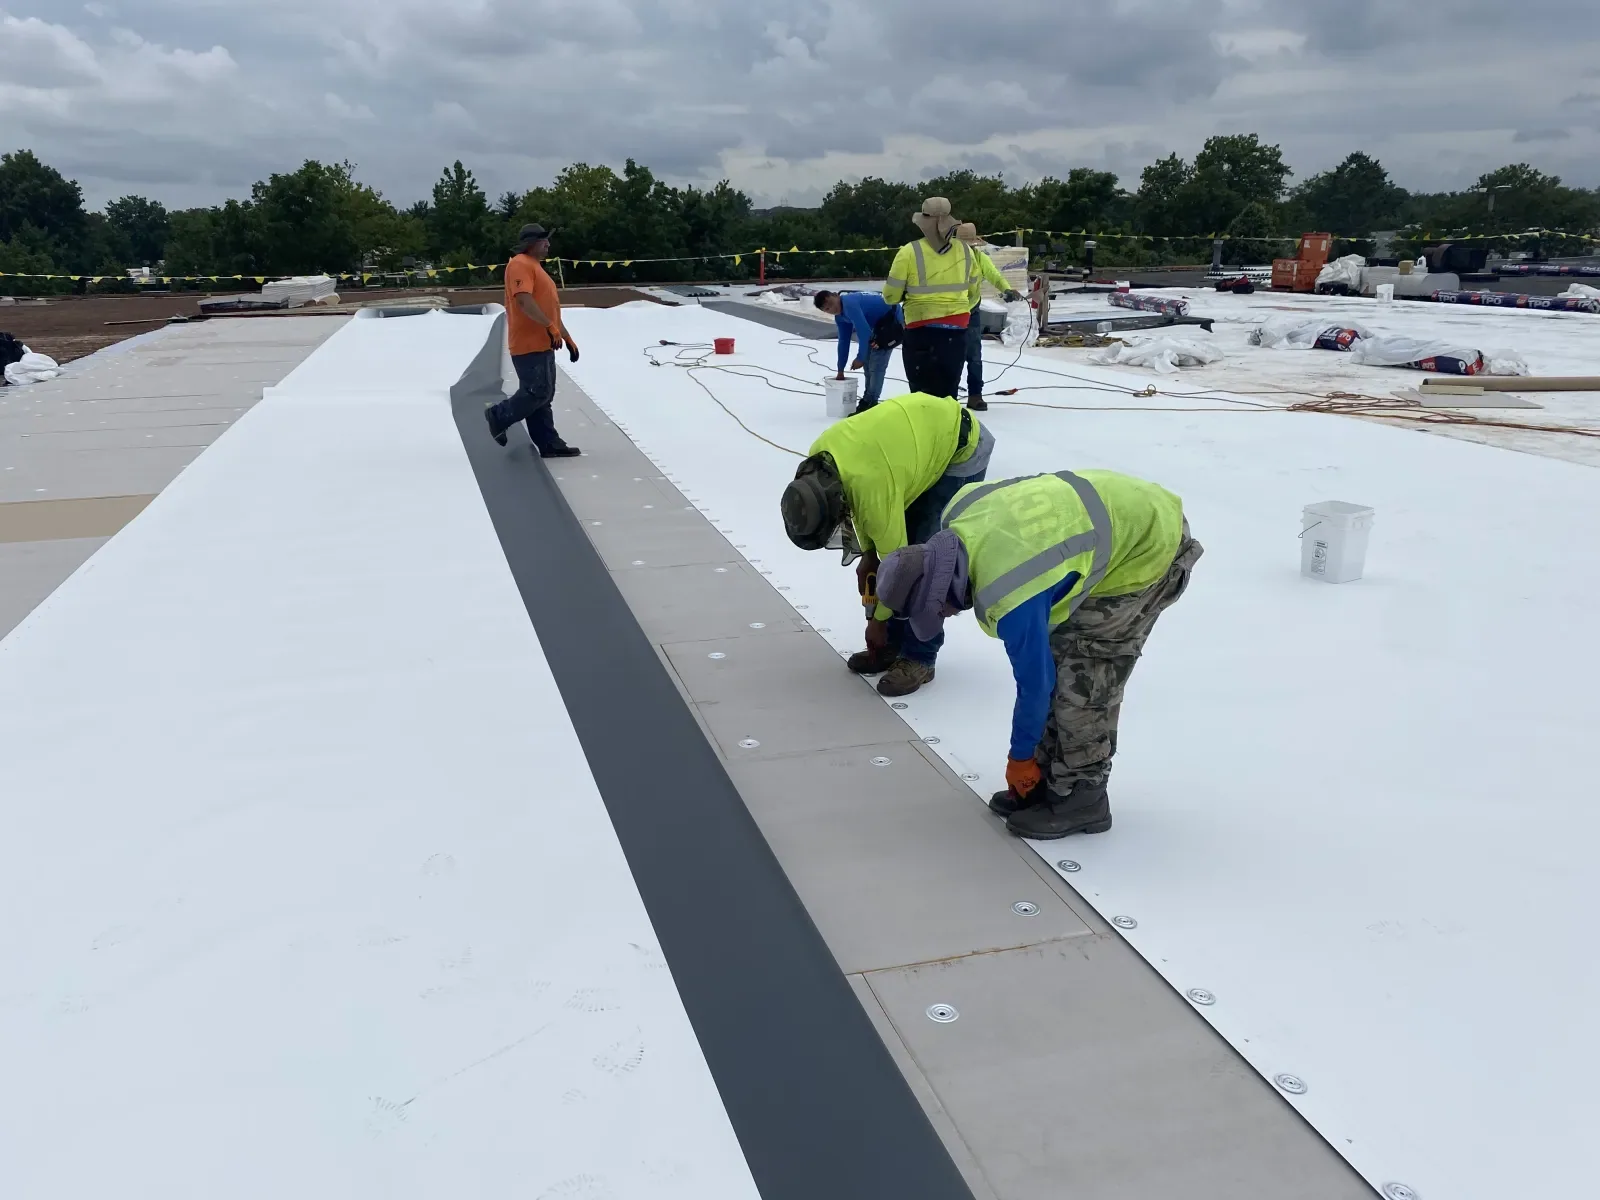
Infrared Moisture Survey in Jersey City, NJ
Map commercial roof moisture patterns in Jersey City with infrared imaging, weather notes, marked zones, and a field confirmation plan for repair decisions.
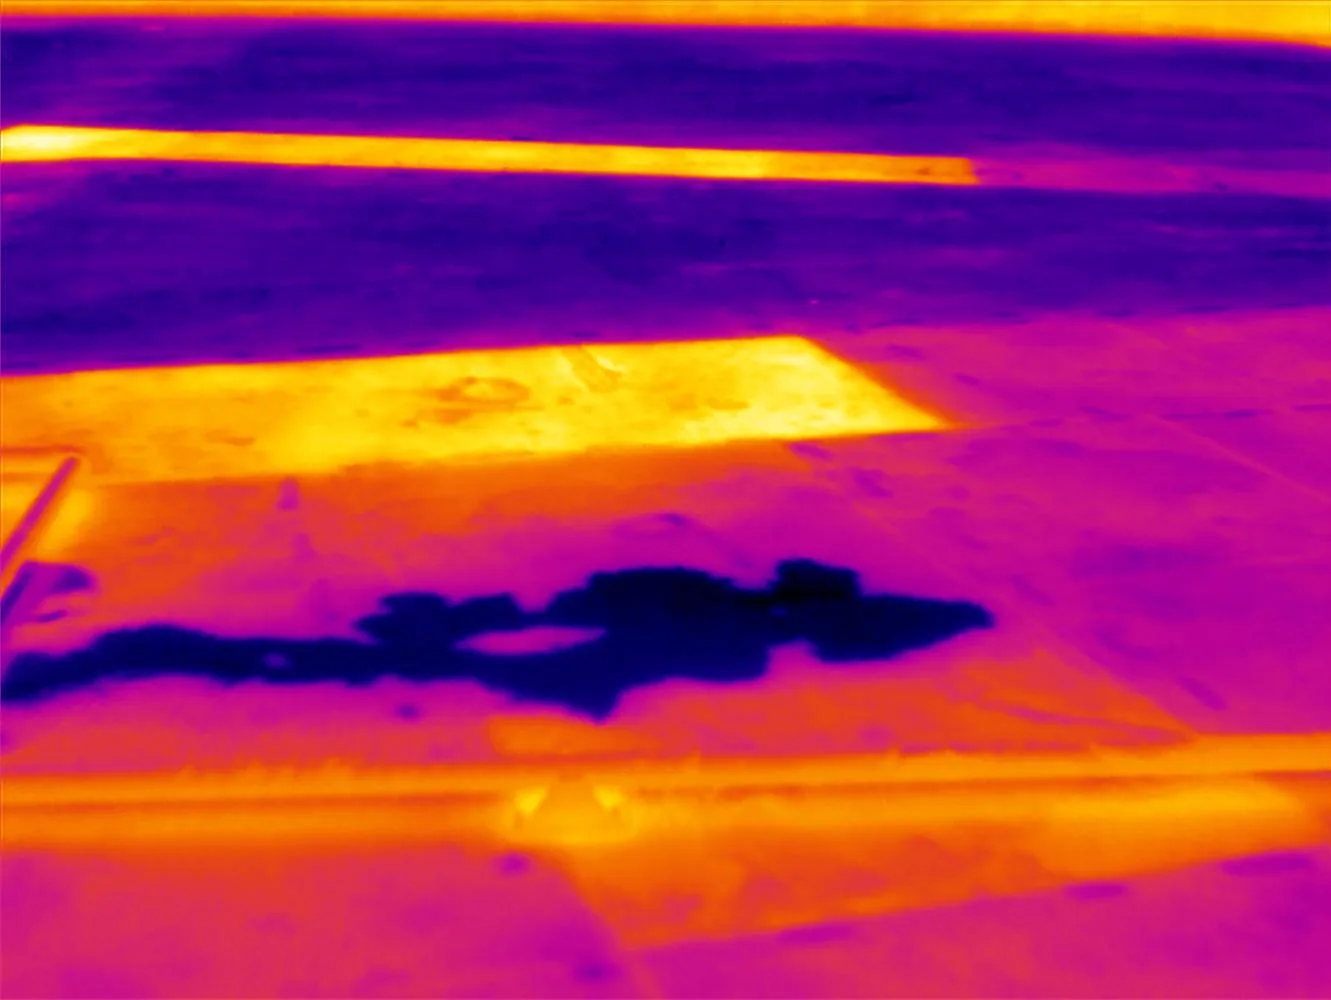
Map commercial roof moisture patterns in Jersey City with infrared imaging, weather notes, marked zones, and a field confirmation plan for repair decisions.
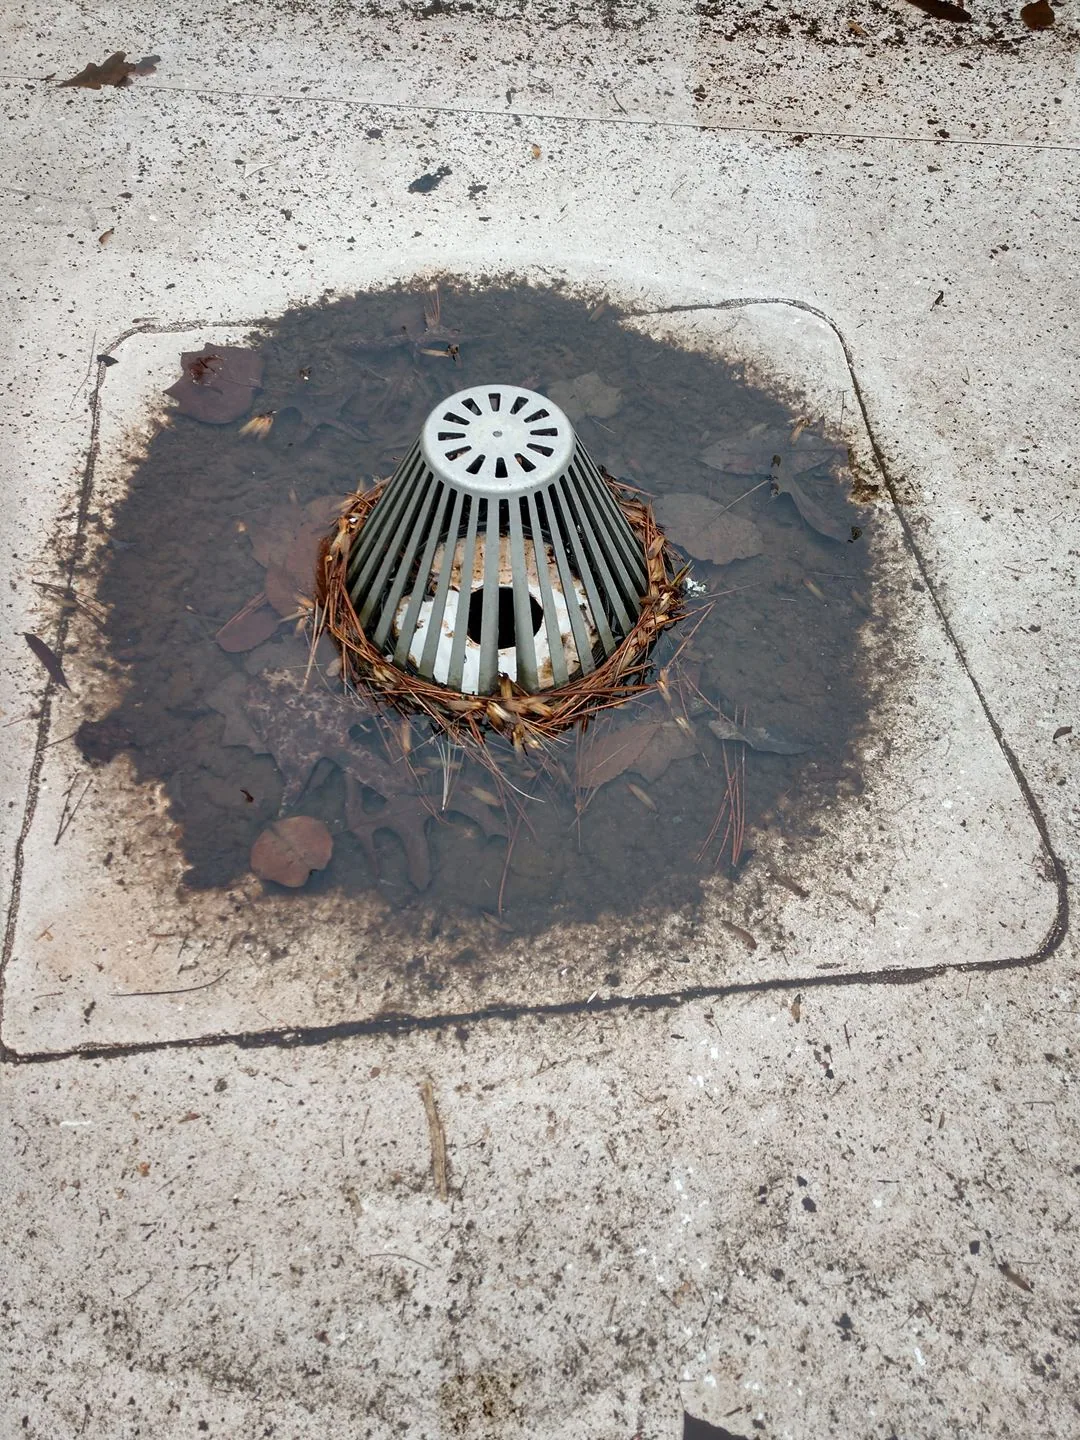
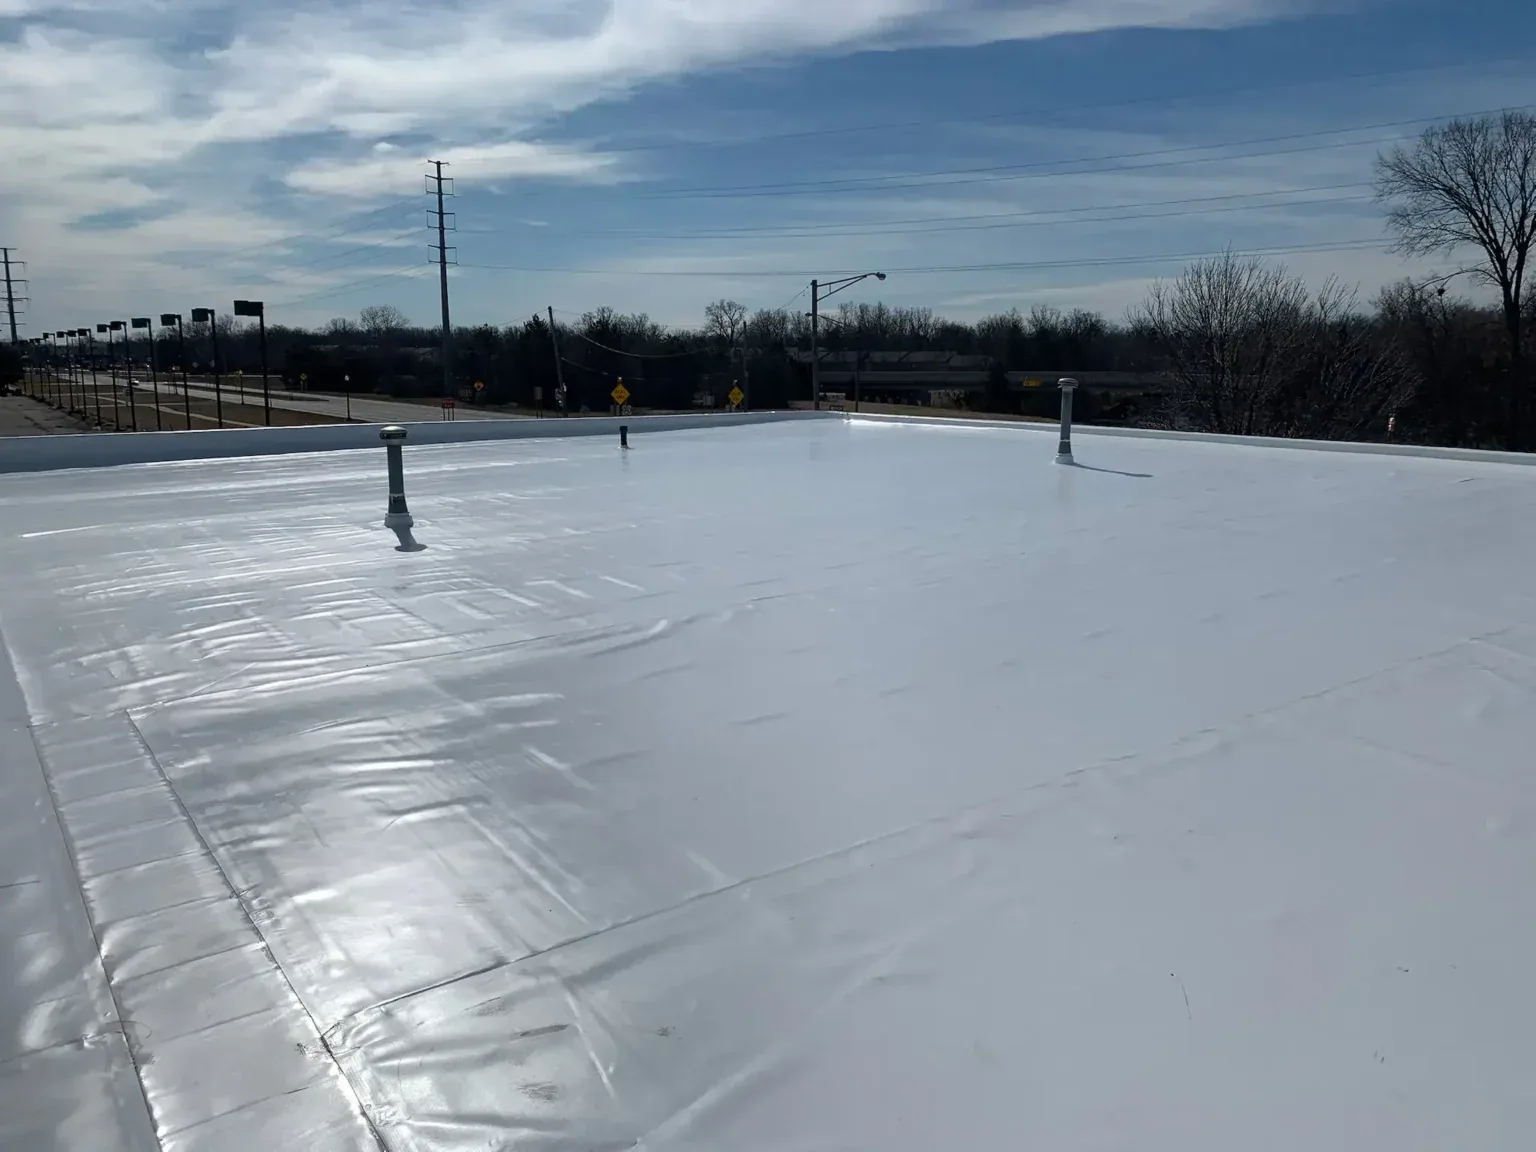
Thermal contrast can help target a moisture investigation on a Jersey City commercial roof. We plan the scan around surface conditions, insulation layout, recent weather, and access. The resulting pattern indicates where a test may be useful; it does not confirm wet material by itself. A commercial roof inspection combines the image with visible seams, drains, and interior reports before scope is set.
Flood impacts from Irene and Sandy remain part of Jersey City’s roof-water context, and stormwater loading affects the city’s combined sewer system. Those conditions make a careful drainage and moisture review practical. We identify the question the scan must answer, map the roof zones, and leave the owner with a marked comparison and a next step for confirmation.
Infrared readings respond to differences in temperature at the roof surface. Sun exposure, clouds, wind, prior rain, rooftop equipment, and insulation changes can all shape the pattern. We review those conditions before deciding when to collect images. If the roof has not reached a useful thermal window, we reschedule rather than present an indistinct scan as a finding.
The property contact also identifies wet areas reported inside, recent repair locations, roof access, and equipment that may remain warm. We map those against the roof plan and note locations hidden by penthouses or parapets. Jersey City’s dense urban blocks can limit vantage points and create shade. The scan plan records those limits so the owner knows which roof zones were captured and which require hands-on access.
Share recent leak reports, roof access rules, and repair history. We will confirm scanning conditions, map roof zones, and recommend any opening needed to verify moisture.
We divide the roof into named zones and capture each from a consistent route. The operator records the viewing angle, weather conditions, and visible features that may affect interpretation. A broad scan shows relative patterns; a close view helps locate an anomaly beside a drain, curb, wall edge, or membrane seam. Labels connect the image to the roof plan and the maintenance record.
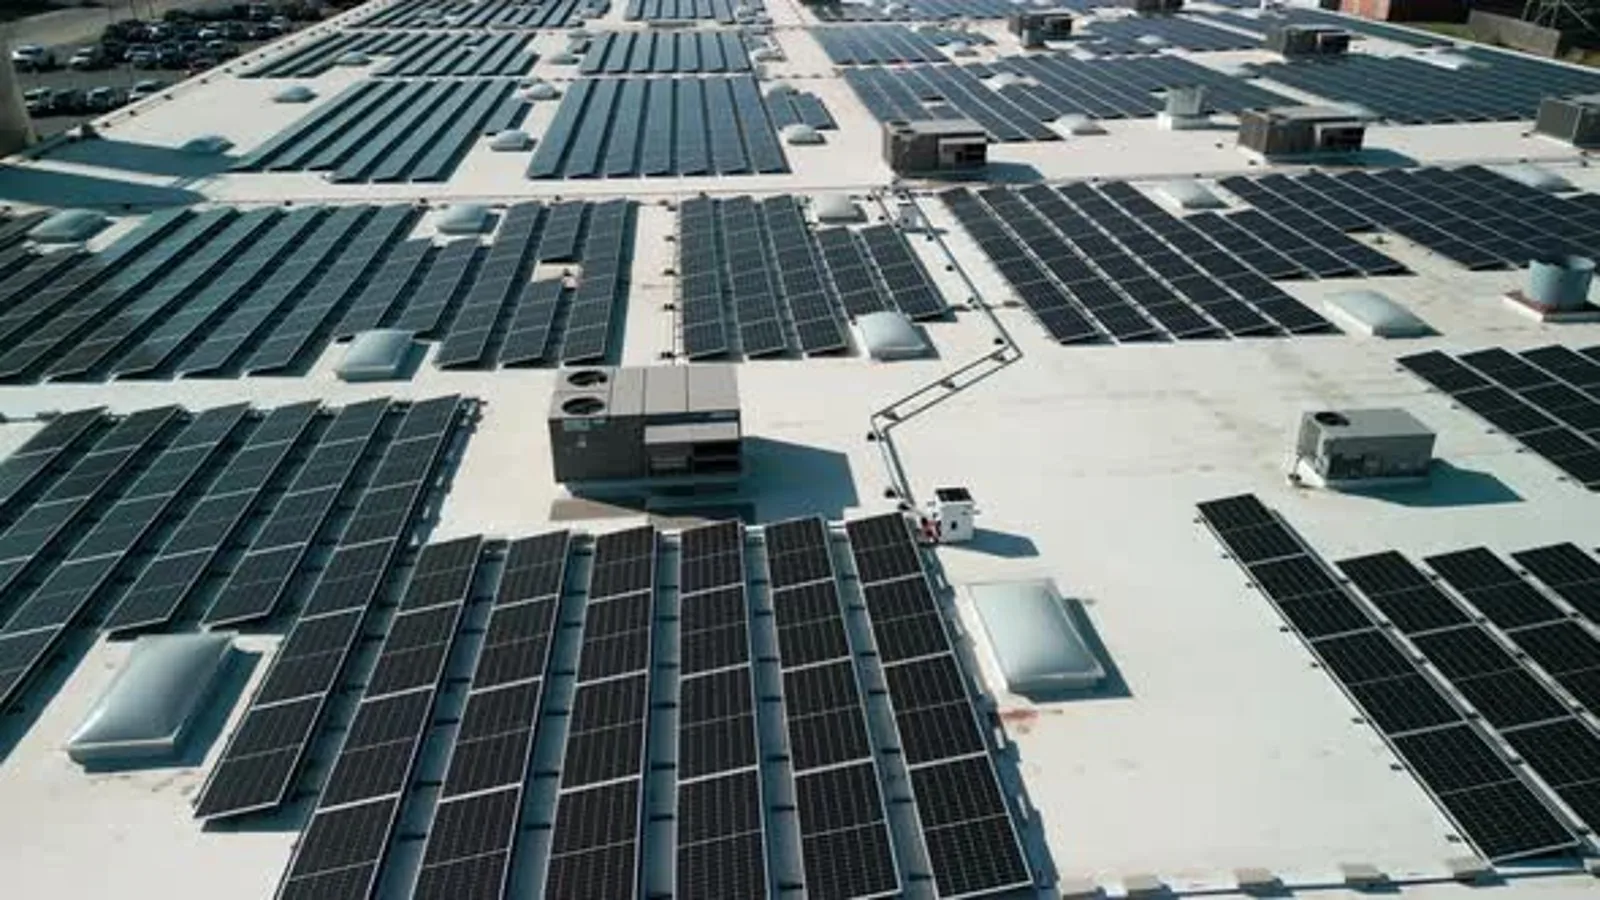
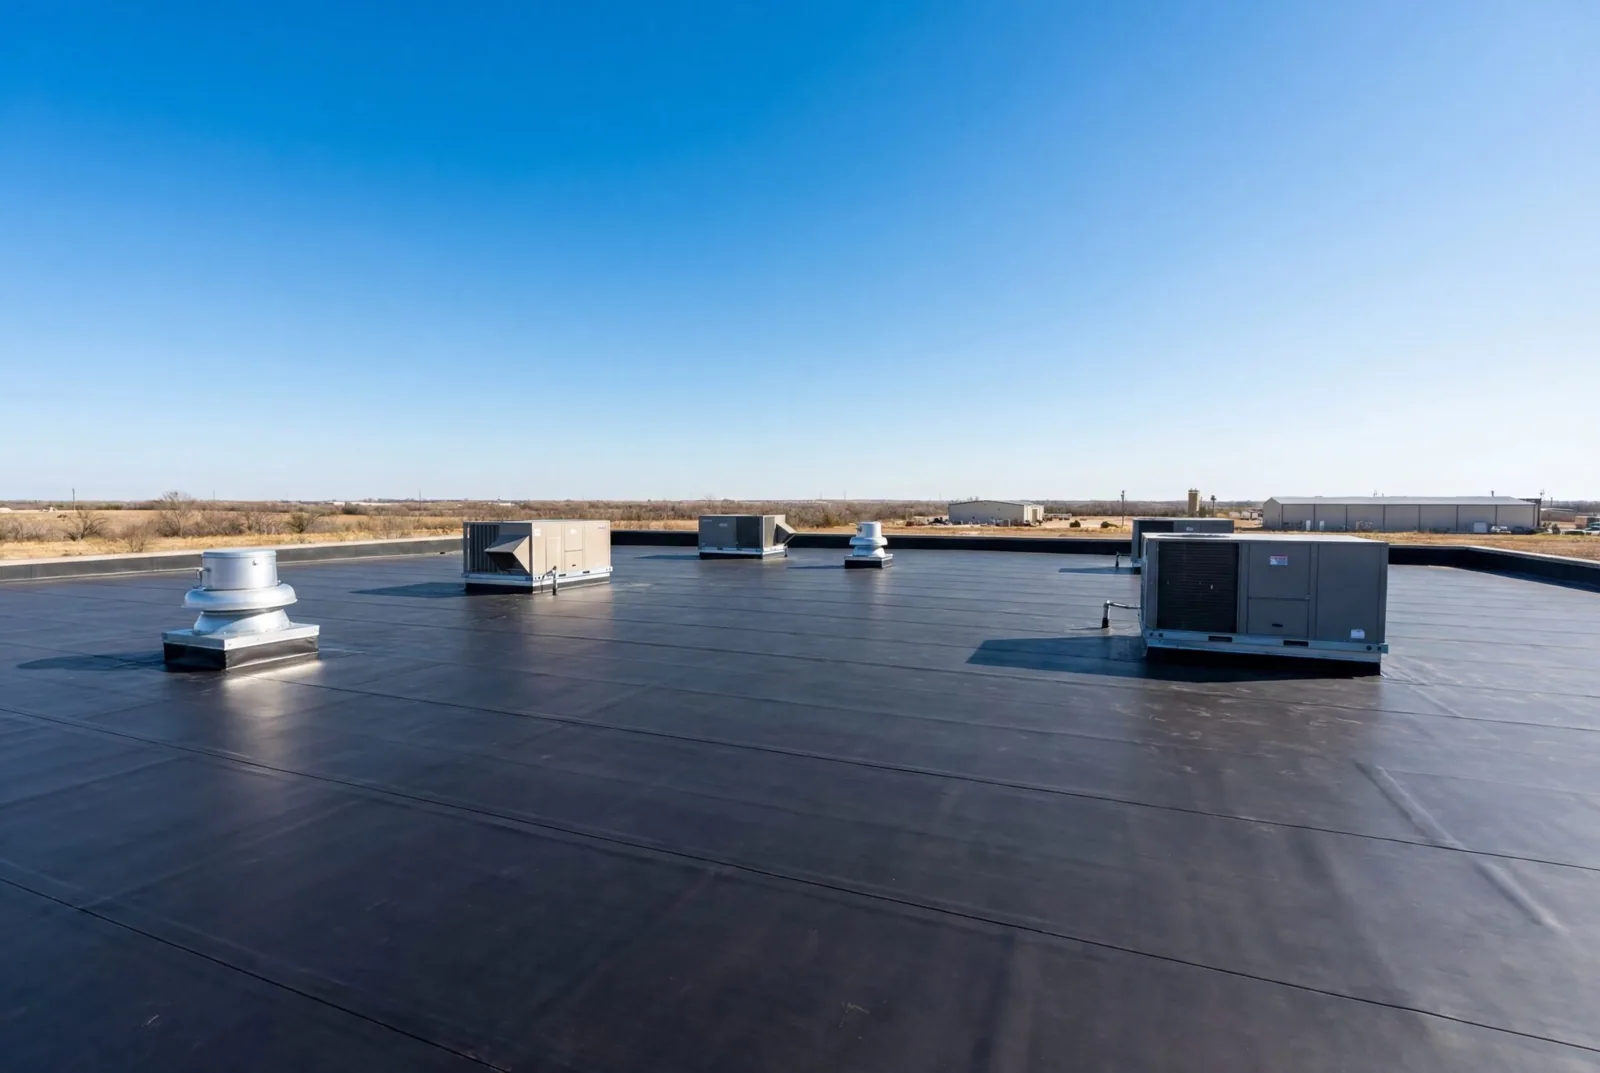
Commercial activity along Central Avenue, West Side Avenue, and the Route 440/Culver area covers varied property types. We do not infer insulation or roof assembly from location. The site walk identifies the actual membrane, roof layers where known, and access restrictions. If equipment blocks a section, we mark the blind area and avoid drawing a conclusion beyond the captured surface. A drone survey can add overhead context when safe access and image conditions allow.
A thermal anomaly is a temperature difference, not a diagnosis. We compare it with drainage paths, interior water reports, visible repairs, and roof geometry. A warm or cool shape may reflect retained moisture, but equipment, shade, ballast, or a change in material can produce a similar image. The report distinguishes the observed pattern from the explanation that still needs confirmation.
Jersey City’s six large districts include Downtown, Journal Square, The Heights, and Bergen-Lafayette; each site still needs an address-specific roof plan. We mark an anomaly by zone and size, then identify the safest test location. If the pattern aligns with a seam or drain, a repair review can follow the physical defect after it is confirmed. We keep the scan map useful by labeling both findings and uncertainty.
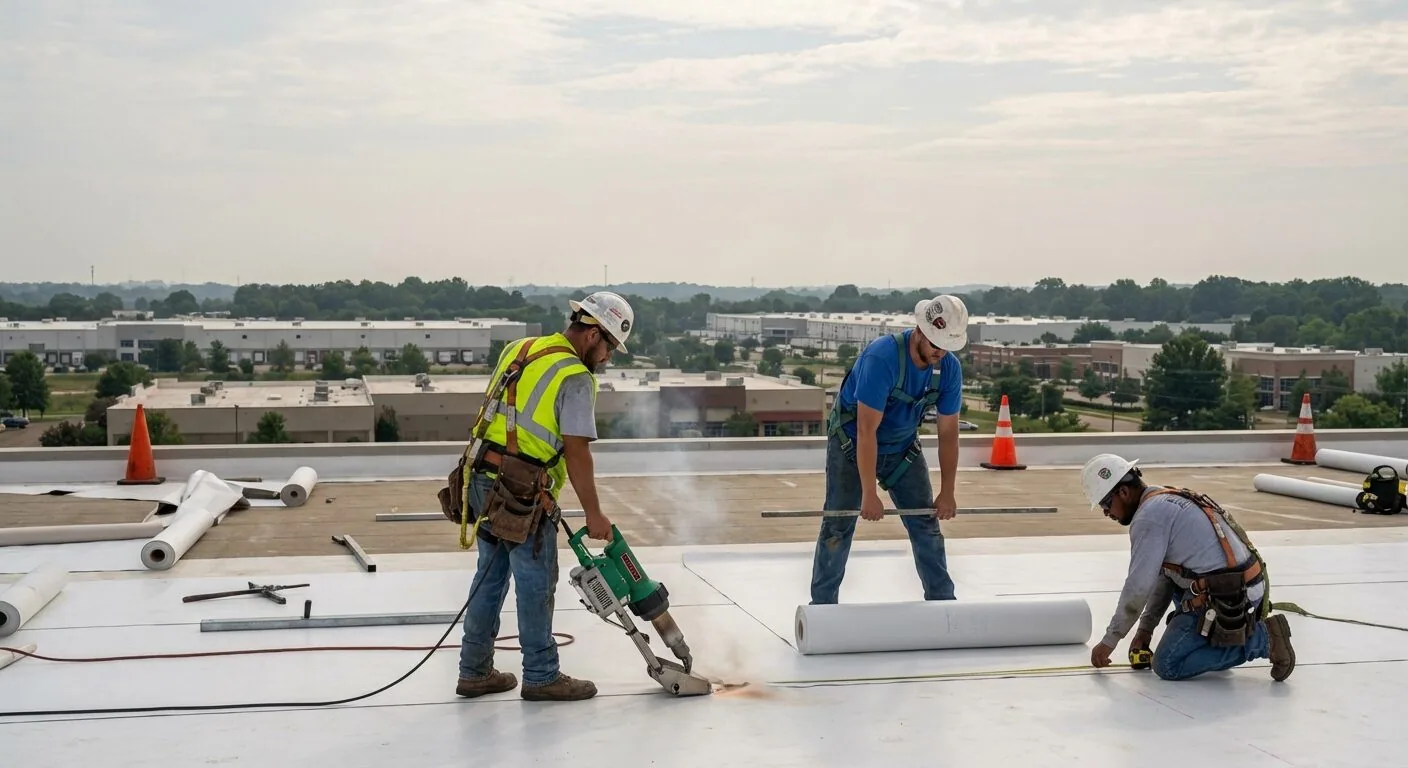
A selective opening can confirm whether insulation is wet and show the layers beneath the membrane. We discuss its location, roof protection, and the decision the result could change before the owner authorizes it. The crew records the assembly and closes the area with compatible materials. If a test cut is not appropriate, a hands-on inspection of seams, edges, drains, and soft areas can refine the next step.
We compare scan indications with direct observations rather than treating one method as a substitute for the other. The map notes which locations were opened and what the materials showed. If confirmed moisture spans a larger zone, the owner can compare removal, repair, recover, or replacement. A membrane system review helps ensure a repair detail follows the assembly that the test actually exposed.
The scan can help the asset manager prioritize where to spend inspection time. We rank zones by the combination of thermal pattern, active leak report, surface defect, and potential consequence below. That is a work sequence, not a condition rating for unseen material. The written report identifies areas to test now, areas for maintenance, and sections without an actionable anomaly.
Where moisture is confirmed, we estimate the area that needs removal and note any concealed deck questions. Before the budget review, we map likely wet and dry zones together and pair each with a proposed response. The owner can schedule a test cut, carry a suspect area as an allowance, or defer work with a monitoring date. The report lists access limits, affected tenants, and roofing operations that need to coordinate. Each test location remains distinct in the estimate. If the dry portion remains serviceable, a localized correction may preserve it. If several layers are affected, a replacement scope can compare the affected zones and tie-ins. For an asset in Kearny, we prepare an independent scan map rather than transferring Jersey City readings to another building.
The deliverable includes a roof-zone map, selected thermal and visible images, collection conditions, anomaly notes, and recommended confirmation steps. We label each pattern with its status: observed, tested, or unresolved. The owner can give that record to maintenance or a capital team without losing the difference between image evidence and confirmed wet insulation.
Commercial corridors and industrial areas occupy different parts of Jersey City, but the useful baseline comes from the property’s own roof plan and repair history. We can repeat the scan from comparable viewpoints after repairs or a dry-in project. A condition report can keep thermal images beside field photos. A maintenance plan then sets the next drain and seam check.